Using the EIGER 4M for Single Crystal X‑ray Diffraction on Catalase
Introduction
 Hybrid Photon Counting (HPC) detectors provide state-of-the-art technology for X-ray detection in the home X-ray crystallography laboratory. First, each pixel is a direct X-ray photon counter. Second, there is no readout noise or dark current, which improves the signal-to-noise ratio in reflection measurements. Third, the single pixel point-spread function yields excellent spatial resolution of reflections. Fourth, the quick readout times allow for shutterless collection and shorter wall-times for diffraction experiments. The Dectris EIGER R 4M is currently the largest HPC detector with the smallest pixel size (75 x 75 μm) available for the home X-ray laboratory. The large imaging size has the advantage of increasing the redundancy and resolution of reflections recorded in a single scan. The small pixel size has the advantage of allowing closer crystal-to-detector distances, which decreases the number of images and time required to reach higher-resolution data. To illustrate these advantages, we have collected data on a catalase crystal using the EIGER R 4M and solved its structure to 1.7 Å.
Experimental overview
Beef liver catalase was purchased from Sigma. A volume of 0.5 mL of the catalase suspension was centrifuged and the supernatant used to set up crystallization drops. Hanging drops consisting of 2 μL of catalase plus 2 μL of crystallization solution [0.1 M potassium thiocyanate, 0.1 M HEPES pH 7.0, 15% PEG 3350, 20% ethylene glycol] over a well containing 1 mL of crystallization solution were prepared in a 24-well Linbro plate. The plate was placed at 30ºC for 2.5 days to initiate crystal growth and then transferred to 18ºC for storage and continued crystal growth. The system specifications are listed in Table 1. Data collection was performed using StructureStudio, processing was performed using XDS1, and structure solution steps were performed using the HKL-3000R² interface. The catalase crystal used here is shown in Figure 1.
Table 1: System specifications
| X-ray source | MicroMax007-HF |
| Operating power | 30 kV x 40 mA = 1.2 kW |
| X-ray optic | Confocal VariMax FWHM = 210 μm Divergence = 4.8 mrad |
| Beam characteristics | FWHM = 210 μm Divergence = 4.8 mrad |
| Collimator | 300 μm |
| Goniometer Detector range |
4-circle ¼ chi / dist = 40 - 300 mm, 2θ = 0 - 90º |
| Detector Active area Readout time Pixel size Cooling |
Hybrid photon counting EIGER R 4M 155.2 x 162.5 mm 10 µs 75 x 75 µm Water |
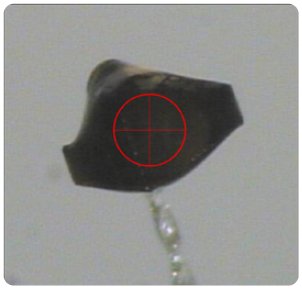
Figure 1: Catalase crystal. Crosshairs shows the beam position, and the circle is 0.2 mm in diameter.
Results
A crystal of catalase was mounted and screened using the EIGER R 4M. The crystal diffracted beyond 2 Å and auto-indexing revealed a primitive, orthorhombic cell a = 84 Å, b = 140 Å, and c = 230 Å. Because of the small pixel size and one-pixel point spread function, an EIGER detector can be placed at a distance of 3.6 times less than the longest primitive cell edge to record reflections while still achieving spot separation on the longest edge.
Therefore, a detector distance of 65 mm was used here and the spot separation on the 230 Å edge is clearly shown in Figure 2. Note that this spot separation is achieved with the full divergence of the X-ray beam. Using 5-second exposures per 0.1° of rotation, a two-scan strategy was calculated by Rigaku Collection Strategy to give complete data to 1.8 Å (Table 2). The two scans were collected in 2 hours and 42 minutes.
Table 2: Scans collected on catalase
| Scan # | Distance | ω start | ω range | Δω | φ | Χ | 2θ | No. img | Time / img | Total Exposure |
| 1 | 65 mm | -89° | 119.8° | 0.1° | 90° | 45° | 0° | 1198 | 5 s | 1 h 39 m 50 s |
| 2 | 65 mm | -89° | 74.8° | 0.1° | 180° | 20° | 0° | 748 | 5 s | 1 h 2 m 20 s |
| 2 h 42 m 10 s | ||||||||||

Figure 2: 5-second exposure per 0.1° rotation of the catalase crystal at distance of 65 mm. Zoomed in panels show the lunes along the 230 Å cell edge.
The processed data had usable signal and completeness to 1.7 Å (higher resolution than any bovine catalase in the PDB) and yielded an overall Rmerge of 8.7% (Table 3). Phases were obtained by molecular replacement with MOLREP³ using the tetrameric catalase from PBD ID 1TH3 as a search model (with the waters, ligands, and side chains removed). The structure was rebuilt using ARP/wARP⁴ and finished by several rounds of manual model building using COOT⁴ and refinement using REFMAC⁶.
The final model contains four protein chains (each ~495 residues), four heme molecules, 4 NADPH molecules, and 1700 water molecules (Figure 3). The model has a low R factor (18.5%) and excellent stereochemistry (Table 3). The quality of the electron density maps is shown in Figure 4 for the heme and NADPH binding sites in chain A of the final model. A strong peak in the anomalous difference map was observed for all four Fe atoms.
Results
Table 3: Data collection and refinement statistics.
| Space group | P2₁2₁2₁ |
| Unit cell: lengths (Å) | 83.9, 140.5, 230.8 |
| Resolution (Å) (last shell) | 30-1.7 (1.74-1.7) |
| Total # reflections | 1897191 |
| Unique # reflections | 293223 |
| Completeness (%) (last shell) | 98.3 (87.7) |
| Multiplicity (last shell) | 6.5 (3.1) |
| <I/σ(I)> (last shell) | 14.4 (1.8) |
| Rmerge (%) (last shell) | 8.7 (58.5) |
| CC1/2> (%) (last shell) | 99.8 (61.7) |
| Rcryst / Rfree (%) | 18.5 / 21.1 |
| Ramachandran outliers (%) | 0.25 |
| Molprobity⁷ clashscore | 6.17 |

Figure 3: Cartoon representation of the catalase tetramer with each monomer as a different color. The four heme molecules are shown in blue stick representation. The four NADPH molecules are shown in white stick representation.

Figure 4: Heme (left) and NADPH (right) binding sites in a monomer of catalase. 2Fo-Fc (grey mesh @ 1.5 rmsd), Fo-Fc (red and green meshes @ -3 and 3 rmsd, respectively), and anomalous difference (black mesh @ 5 rmsd) electron density maps are shown. The Fe atom in the center of the heme is magenta.
Conclusion
A 1.7 Å fine-sliced data set was collected on the orthorhombic form of bovine catalase in less than three hours using the gold standard MicroMax007-HF rotating anode and the EIGER R 4M HPC detector. The large format of the EIGER R 4M combined with its small pixel size allowed us resolve the long 230 Å cell edge at a distance of 65 mm. The data were easily solved by molecular replacement and a model was refined to an R factor below 20%. This is a synchrotron-quality result from a home lab system.
References
[1] Kabsch, W. (2010) Acta Cryst. D66, 125-132.
[2] Minor W., Cymborovski, M., Otwinowski, Z., & Chruszcz, M. (2006) Acta Cryst. D62, 859-866.
[3] Vagin A. & Teplyakov A. (1997) J. Appl. Cryst. 30, 1022-1025.
[4] Langer G., Cohen S.X., Lamzin V.S. & Perrakis A.(2008) Nature Protocols 3, 1171-1179.
[5] Emsley P., Lohkamp B., Scott W.G. & Cowtan K.(2010) Acta Cryst. D66, 486-501.
[6] Murshudov G.N., Vagin A.A. & Dodson E.J. (1997) Acta Cryst. D53, 240-255.

Contact Us
Whether you're interested in getting a quote, want a demo, need technical support, or simply have a question, we're here to help.