Copper Concentrate by Pressed Powder
Introduction
Copper is one of the essential base metals in modern infrastructure. It is used for construction, electronics, machinery, automobile and marine vessel etc. in the form of electric cable and copper alloys.
Copper ore mined as mainly sulfide ore is usually shipped as concentrate of 20 – 40% in copper content after processing at the plant near mine site.
Copper concentrate contains a variety of impurities that are either valuable elements as byproducts, or harmful to quality in copper metal products and hazardous to the environment and human health. In modern copper deposits, ore grade of copper is decreasing while impurities in ore tend to increase. Therefore, the demand for rapid and accurate determination of various metals of major and trace amounts in copper ore and concentrate is increasing. X-ray fluorescence spectrometry is the best method for the analytical requirements of routine analysis to monitor ore grade with high precision, accuracy and rapidity.
This application note will show the conventional calibration method of copper ore concentrate analysis and also standardless analysis using the fundamental parameter method.
Instrument
The Supermini200 is sequential wavelength dispersive X-ray fluorescence (WDXRF) spectrometer. The WDXRF system has both high resolution and high sensitivity for light elements. Since copper concentrate contains multiple heavy elements with close and overlapping spectral lines, high spectral resolution is essentially required for the analysis.
The Supermini200 is a unique benchtop system designed to minimize installation requirements such as cooling water, power supply and installation space etc. It is also equipped with an air-cooled 200W X-ray tube and up to three analyzing crystals, by which elements from oxygen to uranium can be analyzed.
The operation software provides users high flexibility and availability for various applications in easy-to-use operation. Standardless analysis program “SQX” is highly convenient to determine quickly which elements are contained and what their approximate concentrations are in the unknown sample, without any selection and preparation of suitable reference materials.
Reference samples and sample preparation
Fifteen copper concentrate samples were used as references for calibration.
These powder samples were prepared using the pressed powder technique. This method is the most common technique for powder samples in XRF spectrometry because of its simplicity, low expertise level requirement, small time-consumption and cost-efficiency.
The well-dried (2 hours at 105°C) samples and binder added at 10% by mass, were ground in a steel container and then pressed under the pressure of 200 kN into aluminum support ring
Calibration and results
Calibration was performed for the elements of Cu, Zn, Pb, Bi, Ag, As and Cd by using the Supermini200 with Pd target X-ray tube. Path atmosphere was in vacuum and tube condition was 50 kV and 4 mA. Primary beam filter of Zr was used for the measurement of Cd-Kα line to prevent interference from Pd target lines. Measurement conditions are shown in Table 1.
In the calibration of Pb, Bi, Ag and Cd, the matrix effects were corrected by using the scattered tube target X-rays reflected from the sample as an internal standard. The copper concentrates used for calibration, in this note, contain molybdenum in relatively high concentrations. Since the molybdenum line overlaps with Pd-Kα Compton line, the line can not be used as the internal standard (Figure 1). Therefore, a scattered X-rays from the X-ray continuum was applied to the correction.
Calibration curves of the measured components are shown in Figure.2 and 3. Corrected calibration curves were improved in accuracy of calibration compared to the calibration without correction. The accuracies without any matrix correction are 0.0091 mass% (Pb), 43 ppm (Bi), 15 ppm (Ag) and 6 ppm (Cd), respectively.
Table 1: Measurement condition
| Component | Cu | Z | Pb | Bi | Ag | As | Cd | Scattering |
| Line | Kα | Kβ1 | Lβ1 | Lα | Kα | Kβ1 | Kα | |
| Primary filter | out | out | out | out | out | out | in | out |
| Counting time Peak (s) |
20 | 40 | 40 | 40 | 60 | 40 | 100 | 40 |
| Counting time Back (s) |
40 | 40 | 40 | 40 |

Figure 1: Spectral chart adjacent to scattering X-rays of target element for sample including molybdenum
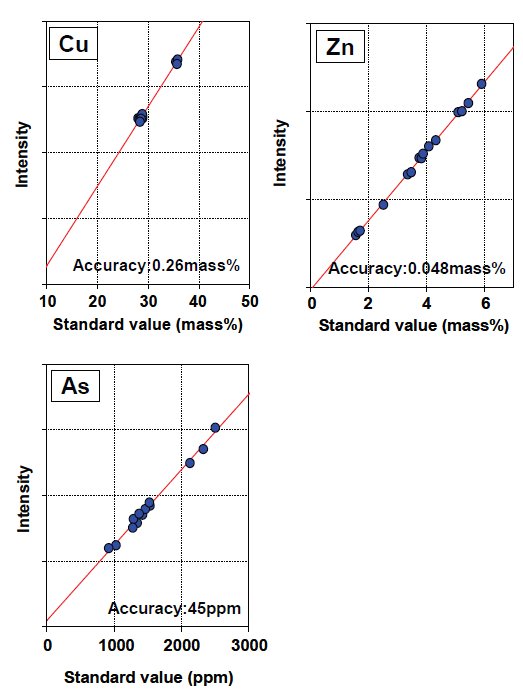
Figure 2: Calibration curves of copper concentrate

Figure 3: Calibration curves corrected by scattering X-ray as internal standard
The accuracy is calculated by the following formula:
$Accuracy = \sqrt{ \frac{\sum_i{(C_i-\hat{C}_i)^2}}{n-m} }$
$C_i$: calculated value of standard sample
$\hat{C}_i$: reference value of standard sample
n : number of standard samples.
m: degree of freedom (linear 2, quad. 3)
To test the precision for Cu concentrate analysis, 10 times measurement were performed. The results are shown in Table 2.
| Component / Element | Chemical Value | XRF | ||
| Average | Std.dev. | RSD% | ||
| Cu | 28.3 | 28.4 | 0.016 | 0.056 |
| Zn | 3.75 | 3.80 | 0.013 | 0.34 |
| Pb | 0.31 | 0.30 | 0.003 | 1.1 |
| Bi* | 1180 | 1211 | 9.5 | 0.78 |
| Ag* | 253 | 266 | 12.9 | 4.8 |
| As* | 1300 | 1349 | 30.7 | 2.3 |
| Cd* | 110 | 120 | 6.2 | 5.2 |
SQX analysis
The semi-quantitative analysis program SQX can be used to obtain the concentrations by theoretical calculation using fundamental parameter and internal sensitivity library without any standards. The calculation is performed by using results of sequential scan measurement from fluorine to uranium. The program is integrated with theoretical line overlap correction function. Therefore, SQX analysis is highly optimized for screening analysis for unknown ore samples with multiple heavy elements.
Table 3 is the result of SQX analysis performed for a representative sample. It shows good agreement with chemical values.
Table 3: Result of SQX analysis unit : mass%
| Component / Element | SQX result | Chemical value |
| MgO | 0.50 | - |
| A₂O₃ | 1.5 | - |
| SiO₂ | 6.5 | - |
| S | 29.6 | - |
| K₂O | 0.34 | - |
| CaO | 1.6 | - |
| Mn | 0.069 | - |
| Fe | 28.3 | - |
| Cu | 29.3 | 28.8 |
| Zn | 1.6 | 1.56 |
| As | 0.24 | 0.21 |
| Mo | 0.25 | - |
| Ag | 0.016 | 0.017 |
| Pb | 0.20 | 0.21 |
| Bi | 0.027 | 0.026 |
Conclusions
The calibration accuracy obtained in this note shows performance, even for trace elements and the repeatability results are precise enough to use for daily analysis.
In this note, a correction technique to use a scattering X-rays of continuous X-rays instead of Compton line was demonstrated. Copper ore mined from some type of deposit, which is example for porphyry copper deposit that is dominant source of ore in the world modern copper mining, often contains molybdenum. In such a case that is unable to use Compton line, another scattering X-rays, such as continuous X-rays is available as an alternative for internal standard method.
The Supermini200 is a benchtop spectrometer with a small footprint and minimal utility requirements. The Supermini200 is optimized to install at on-site laboratories and near the process line in a plant. The benchtop spectrometer with these application techniques can be a powerful tool for he ore and concentrate analysis for both process control and screening.

Contact Us
Whether you're interested in getting a quote, want a demo, need technical support, or simply have a question, we're here to help.